addChart
- getTemplateVariables
- getTemplateVariablesType
- processTemplate
- removeVariableAudio
- removeVariableImage
- removeVariableText
- removeVariableVideo
- replaceVariableAudio
- replaceVariableHtml
- replaceVariableImage
- replaceVariableList
- replaceVariablePptxFragment
- replaceVariableTable
- replaceVariableText
- replaceVariableVideo
- setTemplateSymbol

addChart
 BASIC / ADVANCED / PREMIUM
Inserts a chart into the PowerPoint presentation.
This method allows the insertion of a chart into the PowerPoint presentation.
This method also allows adding trendlines, grids, labels and many other chart features.
chart
Chart type:
- area
- area3D
- bar
- bar3D, bar3DCone, bar3DCylinder, bar3DPyramid
- bubble
- col
- col3D, col3DCone, col3DCylinder, col3DPyramid
- doughnut
- line
- line3D
- ofPie
- pie
- pie3D
- radar
- scatter
- surface
position
| Key | Type | Description |
|---|---|---|
| coordinateX | int | EMUs (English Metric Unit). |
| coordinateY | int | EMUs (English Metric Unit). |
| sizeX | int | EMUs (English Metric Unit). |
| sizeY | int | EMUs (English Metric Unit). |
| name | string | Internal name. If not set, a random name is generated. |
| order | int | Set the display order. Default after existing contents. 0 is the first order position. If the order position doesn't exist add after existing contents. |
chartData
Chart data array: legends, labels and values of the chart.
chartStyles
| Key | Type | Description |
|---|---|---|
| axPos | array | Position of the axis (r, l, t, b). Each value of the array for each position (if a value if null avoids adding it). |
| color | int | Color scheme. |
| font | string | The font to be used. Arial, Calibri... |
| formatCode | string | Number format. |
| formatDataLabels | array | Possible keys and values are:
|
| haxLabel | string | Label for the horizontal axis. |
| haxLabelDisplay | string | How to display the label of the horizontal axis. Possible values are: vertical, horizontal, rotated. |
| hgrid | int | Horizontal grid. Possible values are:
|
| majorUnit | float | Major unit value for bar, col and line charts. |
| minorUnit | float | Minor unit value for bar, col and line charts. |
| orientation | array | Orientation of the axis, from min to max (minMax) or max to min (maxMin). Each value of the array for each axis (if a value if null avoids adding it). |
| scalingMax | float | Scaling max value for bar, col and line charts. |
| scalingMin | float | Scaling max value for for bar, col and line charts. |
| stylesTitle | array | Possible keys and values are:
|
| tickLblPos | string | Tick label position (nextTo, high, low, none). If string, uses default values. If array, sets a value for each position. |
| title | string | The chart title (if any). |
| vaxLabel | string | Label for the vertical axis. |
| vaxLabelDisplay | string | How to display the label of the horizontal axis. Possible values are: vertical, horizontal, rotated. |
| vgrid | int | Vertical grid. Possible values are:
|
The available parameters to display legends and data include:
| Key | Type | Description |
|---|---|---|
| legendOverlay | bool | If true the legend may overlay the chart. |
| legendPos | string | The possible values are:
|
| showCategory | bool | If true shows the categories inside the chart. |
| showLegendKey | bool | If true shows the legend values. |
| showPercent | bool | If true shows the percentage values. |
| showSeries | bool | If true shows the series values. |
| showTable | bool | If true shows the chart data in an associated table. |
| showValue | bool | If true shows the chart data values. |
| trendline | array | Adds trendlines. Compatible with line, bar, col and area 2D charts. Possible keys and values are:
|
Further configuration options for specific chart types are:
| Key | Type | Description |
|---|---|---|
| Bar and column charts | ||
| gapWidth | int | Gap width. |
| groupBar | string | Different ways to group data. Possible values are: clustered, stacked, percentStacked and standard. |
| overlap | int | Overlap. |
| Pie and doughnut charts | ||
| explosion | int | Distance between the different values. |
| holeSize | int | Size of the inner hole (only doughnut charts). |
| Line charts | ||
| smooth | mixed | If true it smooths the line. '0' forces disabling it |
| symbol | string | The possible symbol values are:
|
| symbolSize | int | The size of the symbol used. From 1 to 73. |
Additional available options for 3D charts:
| Key | Type | Description |
|---|---|---|
| perspective | int | Perspective angle. Angles beyond 25 degrees provoke a big distortion in the 3D chart representation. |
| rotX | int | Rotation angle with respect to the vertical axis. Standard values are between 10 and 20 degrees. |
| rotY | int | Rotation angle with respect to the horizontal axis. Standard values are between 10 and 20 degrees. |
Theme options (Available in Premium licenses):
| Key | Type | Description |
|---|---|---|
| chartArea | array | backgroundColor |
| gridLines | array |
|
| horizontalAxis | array |
|
| legendArea | array |
|
| plotArea | array | backgroundColor |
| serDataLabels | array |
|
| serRgbColors | array | series colors |
| valueDataLabels | array |
|
| valueRgbColors | array | values colors |
| verticalAxis | array |
|
Chart type is not supported.
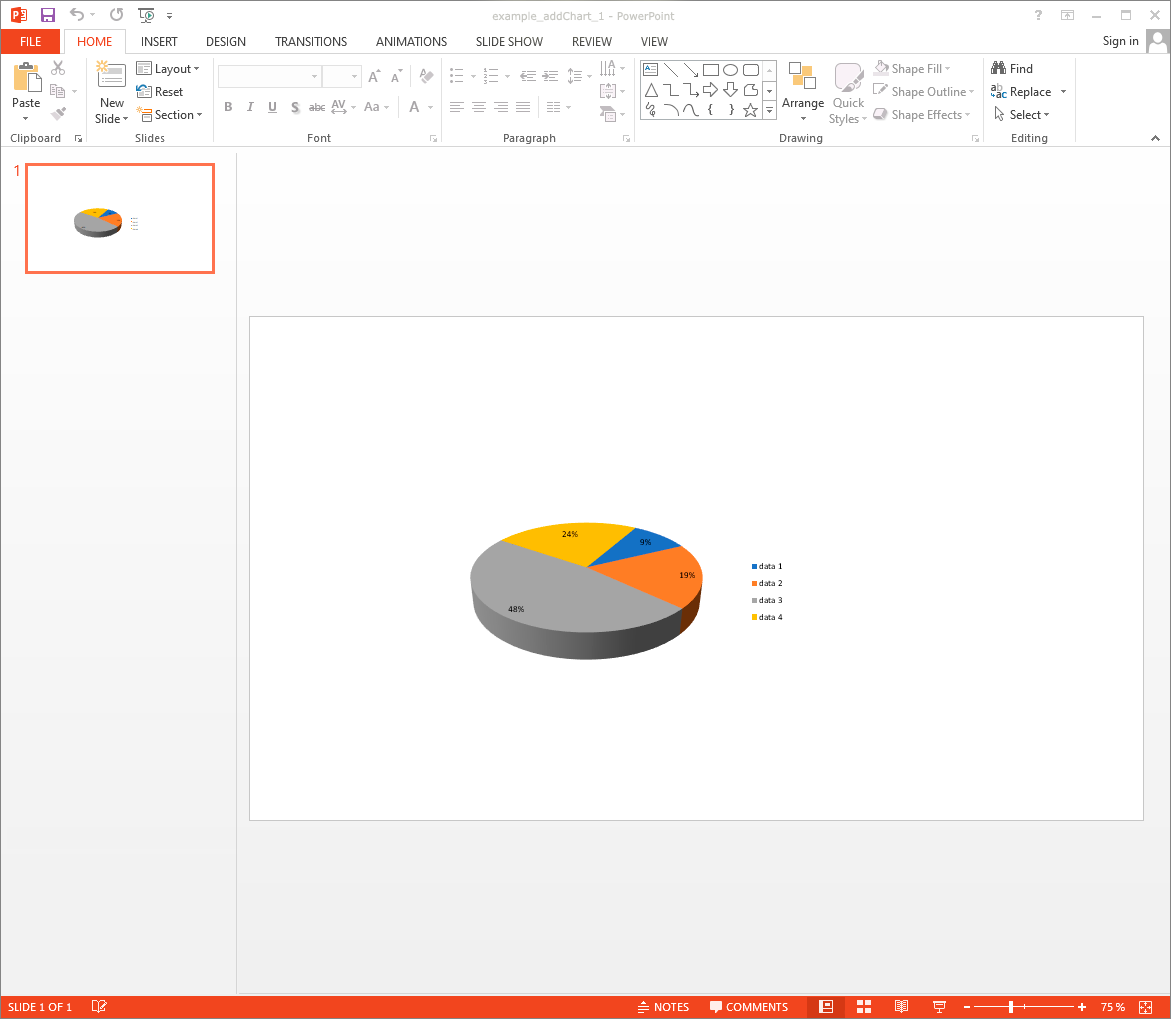
Example #1
The resulting PPTX looks like:
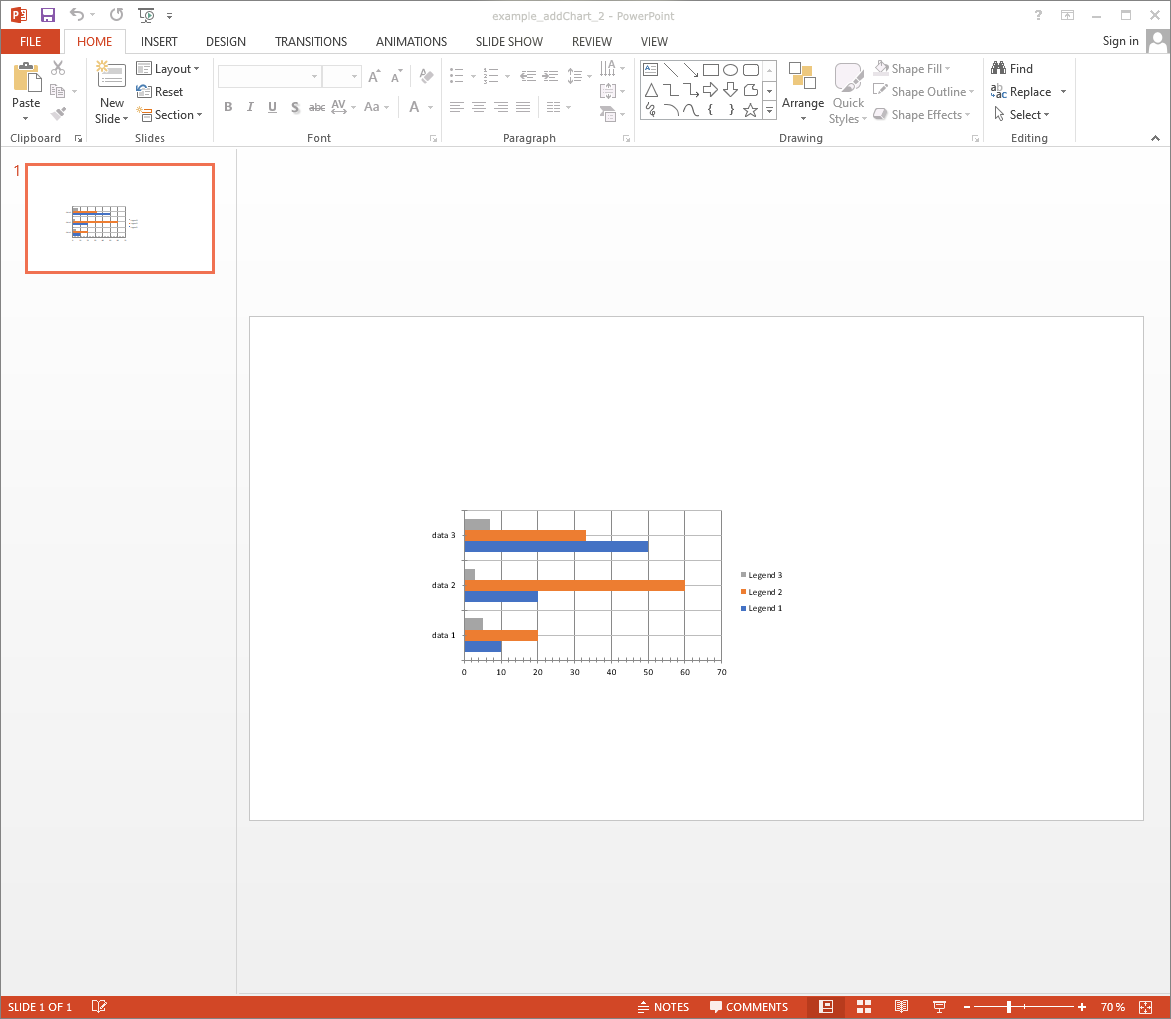
Example #2
The resulting PPTX looks like:
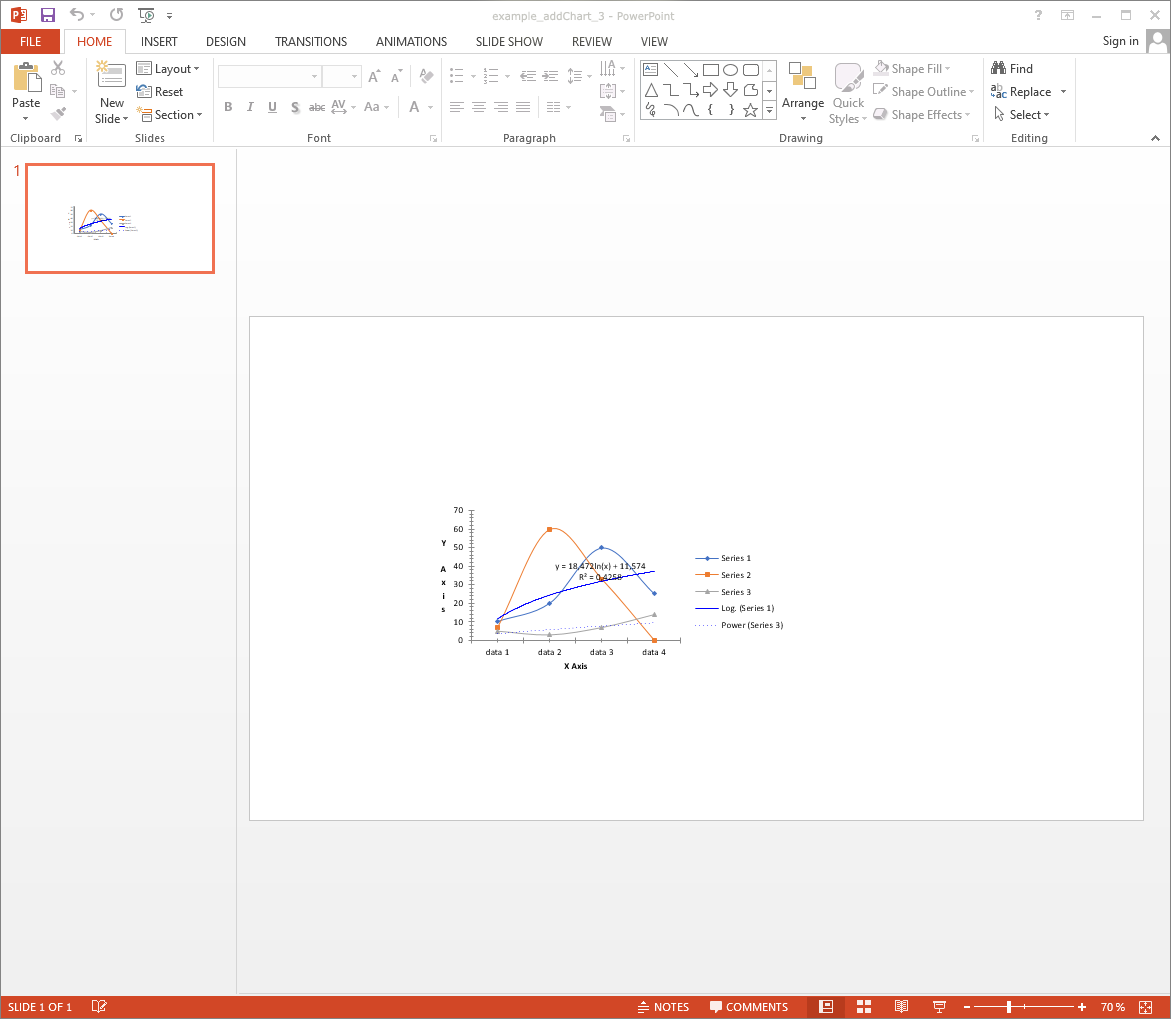
Example #3
The resulting PPTX looks like:
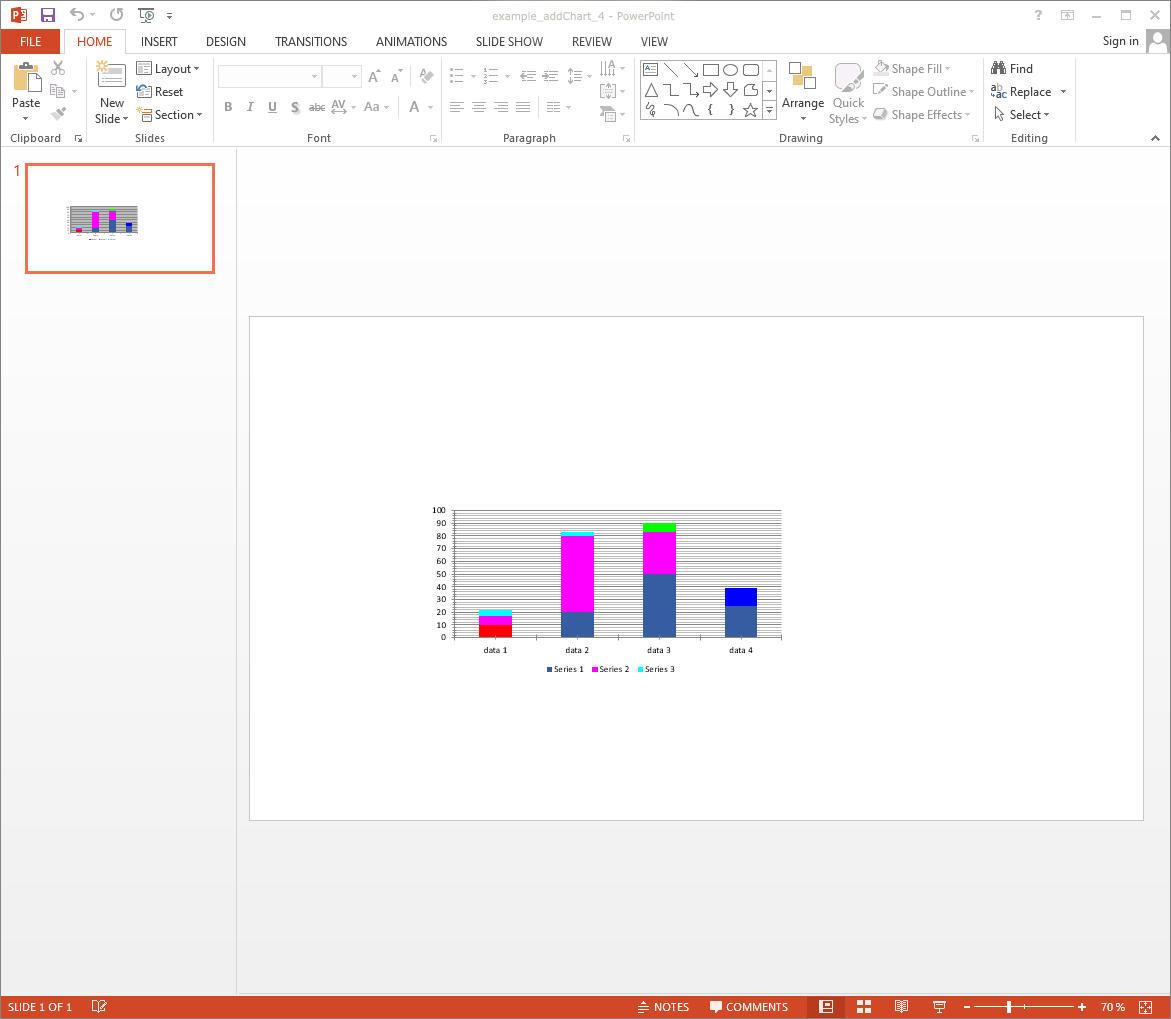
Example #4
The resulting PPTX looks like:
- phppptx 3.5:
- set custom title layout.
- apply font styles to series and values labels.
- valueDataLabels option.
- phppptx 3.0:
- ofPie chart type.
- apply custom colors to lines.
- phppptx 2.5:
- bubble, radar, scatter and surface chart types.
- phppptx 1.0:
- new method.